E-Archive
Science Update
in Vol. 14 - March Issue - Year 2013
Experimental Residual Stress Observations On Peened Aluminium Alloys

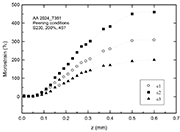
Figure 1: An example of strain gauge measurements showing some divergence of results. Because it is known that the Integral Method (IM) is a suitable method for determining residual stresses, particularly when strong stress gradients are present, it was employed as a means of comparing its results with those obtained with the ISM.
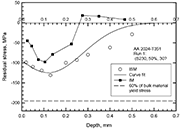
Figure 2: Residual stress distributions of an AA2024-T351 coupon, peened according to the conditions shot=S230, coverage=50% and incidence angle=30
(a)
(b)
(c)
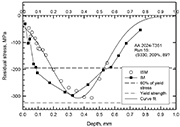
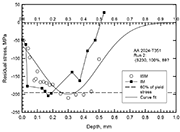
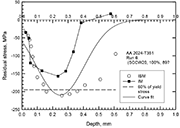
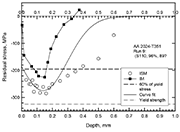
(d) Figure 3: Residual stress distributions of selected AA2024-T351 peened coupons
(a)
(b)
(c)
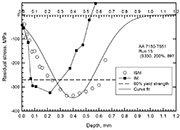
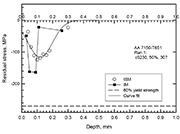
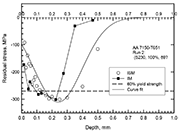
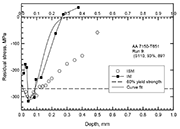
(d) Figure 4: Residual stress distributions of selected AA7150-T651 peened coupons

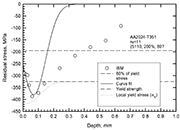
Figure 4: Residual stress distribution of the AA 2024-T351peened coupon exceeding the material
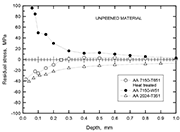
Figure 5: Comparison of the residual stress distribution for the as-received and heat-treated AAs. Determination of the stresses was carried out by using the ISM.
Controlled shot peening is a cold-working treatment in which small balls (usually of cast steel but sometimes of ceramic glass, casting or cut steel wire) collide with the material surface to be treated at high speed. The particles plastically deform and indent the surface. Inhomogeneous plastic deformation gives rise to: (i) roughening of the surface, (ii) an increase in the near surface of dislocation density (work hardening), and (iii) the development of compressive residual stresses (CRS) below the surface. The latter is beneficial to fatigue as it hinders the initiation of fatigue cracks and can slow down the propagation of small cracks because the CRS act as a crack closure stress on the crack flanks. However, propagation of cracks may be accelerated by virtue of the stress concentration effect (roughened surface). Strain hardening, in turn, will retard the propagation of cracks by increasing the resistance to crack tip plastic deformation.
It is clear that the performance of the peening process in terms of fatigue resistance depends on the competition between its beneficial and detrimental effects. Hence, the role of the effects of peening in conjunction with the interaction material-loading conditions has to be analysed and understood in order to achieve a favourable fatigue performance.
Residual stress was measured utilising the Incremental Hole Drilling Technique (IHD). In order to determine the residual stresses for a particular peening condition to a coupon, the strain values measured directly from the strain indicator were computed in accordance with the ASTM E837 Incremental Strain Method (ISM). This is shown in Fig. 1.
A few typical residual stress distributions are presented in Figs. 2 to 3. Curve fits using the Gaussian function (Eq. 1) were carried out to generate the functions that describe the residual stresses which can be incorporated as the closure stresses, ói1, into the CTOD estimations for modelling purposes.
Where
óR = compressive residual stress
A+B = maximum residual stress
x = depth below the surface
Xd = depth to maximum residual
stress
W = a measure of the width of the
stress curve
B = preset residual stress
(prestressed specimens only)
Included in the graphs, as horizontal lines (Figs. 2 to 4) are the bulk material’s yield strength and the 60% of this value. These lines are used as indicators of the influence of the drilling plasticity effect1 when the residual stresses exceed 60% of the yield strength, as reported elsewhere [1].
1 The stress concentration caused by the drilled hole itself gives rise to local plastic yielding (drilling-induced plastic deformations), which can strongly affect the residual stress determination, as the analytical procedures for computing the stresses assume linear-elastic materials behaviour.
The influence of calculation procedures on the residual stress results is apparent in Figs. 3 to 4. A discernible variation between the Integral and Incremental strain methods was observed, particularly at greater distances from the surface. The observed discrepancies can be related to the theoretical shortcomings of each calculation procedure.
In the ISM method, an equivalent uniform stress takes into account the influence of the residual stresses in previous increments. This concept is based on the average stress within the total hole depth, which produces the same total strain as the actual nonuniform stress field. This latter implies that stresses at all given depth increments contribute equally to the strain relief measured at the surface. However, Flaman [2] previously showed that the residual stresses present in the increments close to the surface contribute much more to the strain relaxation than those in deeper increments. The integral method in turn, was specially proposed for correctly considering the strain contribution, when strong stress gradients are present, as pointed out by Schajer [3]. However, this method involves very accurate measurements of the relieved strains and depths for each incremental step, i.e. higher error sensitivity is prone to occur. Because the error is carried forward, the error sensitivity is proportional to the number of depth increments.
Clearly, overestimated IHD residual stress distributions under the ISM compared to the Integral procedure are present in Figs. 3 and 4. However, there is no appreciable smooth compressive stress distribution for the IM plots. This is evidence of the carrying forward of the error due to the large number of incremental steps, specifically near to the surface. In view of the fact that all methods are limited by the decreasing sensitivity to stress relief at deeper increments, the results from the ISM were used in the subsequent stages of this study.
Regarding errors attributed to maximum residual stresses greater than 60% of the material’s yield strength; several authors have reported estimates of the corresponding errors but without considering the local yield strength after surface treatments. Errors have been reported [4] when residual stresses are less than 60% of the material’s yield stress are approximately +10%. An overestimation of 15% can be expected for residual stress magnitudes of 70% yield stress, +20% for residual stress magnitudes of 90% yield stress and up to +35% for stresses reaching 95% of the material’s yield stress.
It has been proven that the work hardening in the surface can largely prevent plastic yielding [4]. Moreover, it was found that the plasticity effect becomes significant when the existing compressive residual stresses overcome 80% of the corresponding local yield strength of the peened material. Based on the proportionality between hardness and yield strength, the local yield strength óly has been successfully determined using the yield strength of the bulk material óy and the relative variation of the microhardness according to the following relationship [4]:
where óy is the material’s yield stress (325 and 450MPa for 2024 and 7150 AA respectively), ∆Hv is the in-depth variation of the Vickers microhardness and Hvbulk is the Vickers microhardness of the bulk material, which was found to range between 120-130 Hv0.1 for the AA 2024-T351 and 140-145 Hv0.1 for the AA 7150-T651.
Close examination of the residual stress distributions for both peened AAs revealed that only run 11 of the AA 2024-T351 exceeded 116% of the material’s yield stress. However, a high work-hardening was also observed in the near-surface layer, as graphically shown in Fig. 4.
It is worth commenting that in the evaluation of IHD data, the determination of the first increment size is less accurate due to e.g. the surface roughness, strain gauge thickness, etc. Thus, the uncertainty in the residual stress determination on the surface is increased. However, the majority of residual stresses results were compressive just below the surface (between 0.030 and 0.040 mm).
Observation of the compressive residual stress evolutions for each of the runs revealed the typically strong influence of the shot type (size) on the depth of the maximum residual stresses. The overall distribution of the residual stresses was found to be very similar between both AA. However, the depth to peak residual stress was marginally higher in the AA 2024-T351 than the AA 7150-T651. This understandably is a manifestation of the material’s properties, e.g. hardness and yield strength. The comparatively higher number of times that the 60% of the yield stress in AA2024 is reached by the compressive residual stresses is another indication of a softer material.
No discernible difference of the residual stresses for unpeened material was observed for both AA. Compressive residual stresses were commonly found in the near surface (from 20µm depth) tending progressively to zero. The appearance of these stresses can be attributable among others to the machining process (particularly milling) during the manufacturing of the specimens. Trends of the residual stresses for the unpeened specimens are plotted in Fig. 5. Because the as-received 7150-T651 AA was heat-treated (artificial ageing), distribution of the residual stresses for both heat-treated and non-heat treated specimens are shown in the same Figure. A completely opposite behaviour was exhibited by the AA7150 in the as-received condition (W51), where a dominant tensile residual stress field was observed near the material surface. This may be due to the 3% stretch given to the as-received material (temper W51).
References
1. Vishay-Measurements Group, Inc., Nov. 1996, "Measurement of residual stresses by the hole-drilling strain gage method." in Measurements Group, Tech note, TN-503-5 (Residual stress measurement). p. 1-19.
2. Flaman, M.T., Mills, B.E. and Boag, J.M., (1987), "Analysis of the stress variation-with-depth measurement procedures for the center-hole-method of residual stress measurement". Experimental Techniques. Vol. 11, pp. 35-37.
3. Schajer, G.S., (1988), "Measurement of non-uniform residual stresses using the hole drilling method. Part1-stress calculation procedures." Journal of engineering materials and technology. Vol. 110, No. Octuber: pp. 338-343.
4. Nobre, J. P., Kornmeier, M., Dias, A.M. and Scholtes., B., (2000), "Comparative analysis of shot-peening residual stresses using hole-drilling and X-ray diffraction methods". Materials Science forum. Vol. 347-349, pp. 138-143.
E-mail: josesolis@infinitum.com.mx
Dr. Ariosto Médina Flores, Dr. Víctor A. Castellanos Escamilla, M.Sc. Alberto Cuevas Salgado
Afiliation:
SEP-DGEST-IT de Tlalnepantla


