E-Archive
Cover Page
in Vol. 11 - March Issue - Year 2010
A Step by Step Analysis of Optimizing the Fatigue Resistance of 2024-T351 Aluminium Alloy by Shot Peening
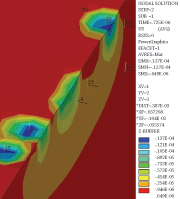
HERCULES software optimization of peening
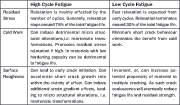
Table 1

Figure 1: Typical roughness profile of the as-received sheet
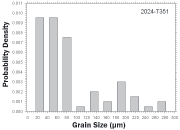
Figure 2: Typical grain size probability density for 2024-T351

Figure 3a: Surface roughness profile after 30 sec chemical etching

Figure 3b: Surface roughness profile after 60 sec chemical etching
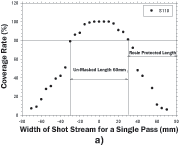
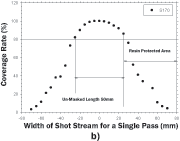
Figure 4: Coverage distribution profile across the shot stream a) for S110 and b) for S170 shot. The arrows showed the hot spot width (un-masked length) and the length to be protected by resin.
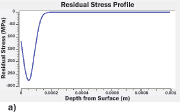
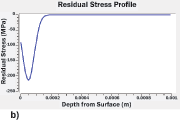
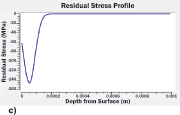
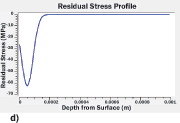
Figure 5: Predicted residual stress profile for S110 at 40m/s: a) as treated residual stress profile; b) at a maximum stress of 230MPa (including relaxation); c) at a maximum stress of 270MPa (including relaxation) and d) at a maximum stress of 320MPa (including relaxation)

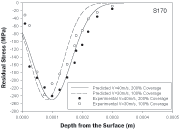
Figure 6: Comparison between predicted and experimental data for S170 at selected conditions according to Table 1
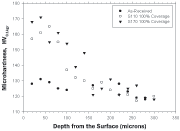
Figure 7: Micro-hardness measurements of cross section of treated samples for two selected sets of peening parameters
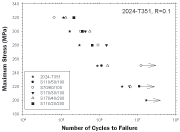
Figure 8: Comparison of fatigue resistance in terms of S-N curve. The arrows indicate run-outs. In the legend the first value denotes the steel shot, the second the shot velocity in m/s and the last the coverage rate. The selected peening parameters were the optimum given by HERCULES.
Introduction
Controlled Shot Peening (CSP) represents the most widely available industrial surface engineering treatment. Impacting is achieved by accelerating the pellets or shot, using means of compressed air or mechanical centrifugal forces. Despite its simplicity, compared to other technologies, i.e. laser shock peening, quality control in CSP is a process requiring significant effort; especially when optimisation of the "final product" is in question. In this work the term "final product" defines not just the distribution of the residual stresses, cold work or the quality of the post treatment surface (roughness) or in more industrial terms the Almen Intensity, but the actual mechanical benefit sought, i.e. optimum fatigue resistance.
In several works it was supported that compressive residual stresses are subject to relaxation with loading cycles and operating temperature. Relaxation was reported to be affected by the far-field maximum stress, the number of imposed cycles as well as the target material. Despite the above, most research works published in the literature have tackled optimization of fatigue resistance via CSP through a single set of peening conditions. In addition it was also reported that large values of cold work can promote near-surface residual stress relaxation. Near surface relaxation is also promoted by surface roughness. Table 1 presents a typical classification of the effects of stress level (low refers to high cycle fatigue and high refers to low cycle fatigue) on CSP products. The comments are based on published literature and experience.
The aforementioned Table was introduced in order to facilitate: a) the fact that there are no panacea solutions under the generalized term the "bigger the better" (high residual stresses and cold work result in higher fatigue life) which for so many years has characterised the process; b) that the target material defines the limits of CSP application and c) the engineer should select CSP conditions as a function of stress level.
In this work, the author attempts, via a step-by-step narrative, to explain the difficulties and the precautions needed in order to achieve such an optimum product. Experimental verification is also included to support the procedure suggested. The article also tries to provide a first introduction of HERCULES, CSP software developed by Superior Shot Peening Incorporated and a number of Universities around the world. The software is based on computational simulation of the shot peening impacts, shot flow characteristics and process control.
1. Process Steps
1a) Target Material
Target material in the form of 1.8mm thick 2024-T351 (solution treated, stretched and naturally aged) sheet was used. Prior to any mechanical treatment/machining, the surface roughness of the sheet material was measured. The results, depicted in Figure 1, indicate that the maximum roughness depth, Rt,max (defined as the vertical distance between the highest and lowest point within an evaluation length) is of the order of 3.7?m and the smallest peak-to-peak distance S was identified as 110?m. In reality, fatigue damage, in the form of cracking, under pure micromechanical parameters, is likely to start from the largest possible grain (potentially maximum number of dislocations) especially when high cycle fatigue is in question. The mean grain size was measured to be 86.6?m, with maximum and minimum value 287.6 ?m and 11.2 ?m respectively. Figure 2, shows the probability density function of the measurements.
Considering only grain sizes with probability density exceeding 0.002, the corresponding fatigue notch factor,1/Z, was found to range between 1.02-1.091.
Step 1b) Controlled Shot Peening
CSP was performed using a fully automated compressed air industrial unit. A set of boron carbide venturi nozzles of internal diameter 12.7mm; exit diameter 17mm and length of 215mm were used. Venturi nozzles are an ideal solution for large flow rates while they produce large and uniform hot spots. Hot spot refers to a length, usually in the middle section of the shot stream where the density of dents produced after impact is statistically uniform. The working distance and angle were continuously monitored. The nozzle was attached to a programmable 3 axis uni-polar CNC step motor kit. The accuracy of the step motor is 0.02m/s. The third axis (z-direction) is linked to the laser distance meter in order to maintain a fixed working distance.
The shot flow rate was controlled via a 590-24 Magna Valve while the velocity of the stream was recorded via Shot Meter - Particle Velocity Sensor. For identifying the best CSP parameters, the commercially available software HERCULES Version 1.21 was used. The software is able to predict the Fatigue Improvement Factor (FIF) also taking into account the relaxation due to maximum operational stress, the number of cycles, the stress ratio, cold work and the mechanical properties of the target material. The software automatically identifies the shot size, flow rate, shot velocity, working distance, impinging angle and travelling speed of the nozzle in order to obtain maximum FIF. Three shot sizes S70, S110 and S170 were selected in order for HERCULES to optimise their process control parameters. It should be noted that especially in soft materials, cold work is more sensitive to the size of the shot than residual stresses and it is highly recommended that flexibility over the shot velocity range is sought. In every case, cold work (CW) was limited to a maximum of 30% using the empirical rule of thumb stating that (100+CW %) times the yield stress of the material should be below the ultimate tensile strength. Such rules prevent potential loss of ductility due to over-peening. Of course the rule is quite conservative since if a high strain rate is employed the mechanical properties of the material elevate to their dynamic values. The hardness of the shot is 52HRC and is manufactured according to SAE J44. Prior to loading the silo the shot was sieved using dedicated screens. Sieving was also engaged in the shot loop. In order to prevent irregular distribution of coverage rate and potentially unwanted distribution of residual stresses and cold work due to peening at areas having coverage below 80%, Dynax 7108 SR masking resin was applied. After several runs the process was optimised to deliver 30m2 in less than 1.1 hours using potentially 16 in-line nozzles. A typical distribution of the coverage profile is shown in Figure 4.
One of the fundamental problems related to experimental work seeking optimisation of shot peening is the use of a single set of CSP parameters to address different stress levels (as in the case of an S-N curve) despite the fact that it is generally accepted that relaxation of the residual stresses increases with stress level. To address the problem HERCULES was engaged in order to deliver the potential relaxation profiles. In its relaxation routine the software takes into account both the effect of surface roughness as well as the amount of cold work. The latter is because CW is known to promote residual stress relaxation. A typical HERCULES output is shown in Figure 5.
To address the above problem, fatigue resistance optimisation was sought against particular stress levels. The corresponding selected parameters are shown in Table 1.
1c) Residual Stress and Cold Work
In order to measure the residual stresses, a 500x500mm section was treated according to the above specifications. Automated open hole drilling HBM MTS 3000 operating at 400,000 rpm was used. The measured strains were transformed into stresses using the integral method. The results shown in Figure 6 represent the average of 6 points taken from a middle section of 50x50mm. The process eliminates edge effects (constraint effects). In Figure 6, the predictive results obtained from HERCULES are also included for comparison. The experimental and predicted data appear to be in accordance.
In addition, micro-hardness measurements from the cross-section of the treated sections were analyzed. The results are shown in Figure 7. The data indicate that both shots induced a significant amount of cold work, with S170 delivering maxima.
In every case, the samples were super finished using ceramic powder to minimise roughness.
2. Fatigue Testing
Fatigue specimens were cut from 500x500mm treated sheets. Each specimen was cut from the middle section of a single sheet. This was done in order to avoid relaxation of residual stresses from multiple machining. This is in contrast to most published works where the specimens are peened after machining. Such practise induces alterations of the edge design due to peening with consequent alterations of the strain flow.
The fatigue loading conditions of the material were at constant amplitude and under frequency from 20 to 25 Hz, depending on the machine. The shape of the wave was sinusoidal. The load ratio used throughout the research was R = 0.1 (R = minimum stress / maximum stress). The results are shown in Figure 8. Each point represents the average taken from 3 specimens. The concept of incorporating the maximum far-field stress in order to obtain the best peening parameters is acknowledged by examining the right hand side results. Herein the reader can easily identify the effect of far-field stress and peening parameters towards fatigue optimisation.
Based on the above narrative, that optimum CSP parameters are subject to specific stress levels the following CSP optimum sets can be identified. At 320MPa the best set is S110/20/200. At 300MPa the best set is S170/40/200 and at 250MPa the best set is S70/60/100. The optimum fatigue limit is given by set S70/60/100. The results also indicate that for 2024-T351, larger shot size and small velocities can provide maximum effect at high stress levels. In contrast, at low stress levels small shot size and high velocities are most advantageous. Comments regarding the kinetic energy should also be avoided since, the contact area during impact and consequently the strain rate, highly depends on shot size and flow characteristics. In general the CSP user should note that unless the contact area is reduced during successive impacts, the residual stresses will not change. HERCULES is designed to see such effect and comparisons against 54 different materials and more than 350 CSP sets have confirmed its potential.
For Information:
Superior Shot Peening, Inc.
13930 Luthe Road, Houston, TX 77039, USA
Tel. +1.281.449.6559
Fax +1.281.449.9115
E-mail: dspinner@superiorshotpeening.com
www.superiorshotpeening.com


