


E-Archive
Articles
in Vol. 3 - August Issue - Year 2002
Quantitative Characterization of Peening Processes Using X-ray Diffraction Residual Stress Analysis
Authors: James Pineault (left), XRD Laboratory Manager and Michael Brauss (right), President of Proto Mfg. Ltd.
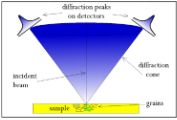
Fig. 1: Diffraction peaks
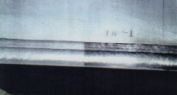
Fig. 3: View of shot peened and masked area of weldment
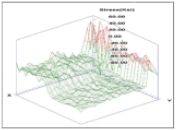
Fig. 4: Stress map on weldment
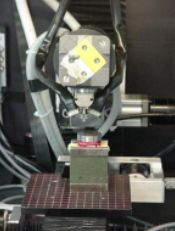
Fig. 5: Measuring residual stress on a shot peened component in the lab
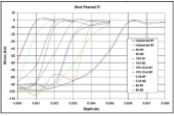
Fig. 6: Comparison of various peening parameter for a component in the lab
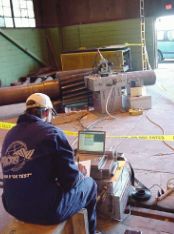
Fig. 7: Measuring residual stress on a component in the field
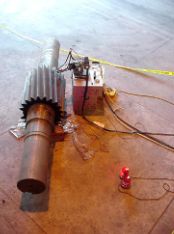
Fig. 8: Measuring residual stress on a component in the field
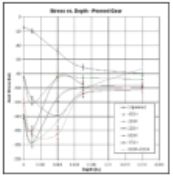
Fig. 9: Comparison of residual stress for various peening parameter
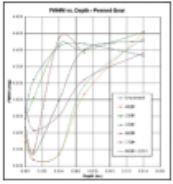
Fig. 10: Comparison of FWHM for various peening parameter
The residual stresses present in manufactured components, assemblies and structures can significantly improve or diminish their useful life. Proto Mfg. Ltd. has been helping companies for over 20 years with the measurement of residual stresses in the laboratory, on the shop floor and in the field by providing both sales of standard and custom instrumentation as well as measurement services.
Why Use XRD Analysis?
X-ray diffraction (XRD) based residual stress measurements have been applied to the quantitative characterization and evaluation of numerous peening processes in a wide variety of applications and industries. As such, XRD has been a very flexible and invaluable tool for process development and optimization where the best peening parameters for a given component must be characterized quantitatively. Components treated with conventional peening/blasting media such as cast shot, cut wire and glass bead (as well as those treated with more unconventional treatments such as laser shock peening) have been successfully characterized using XRD techniques. Peening is often used to introduce compressive surface and near surface residual stresses in components and if applied correctly, can provide a significant improvement in component performance and service life. The designed fatigue life and/or warranty period is achieved or exceeded with the aid of peening in many cases where unpeened components may fail prematurely. Since peening is a value added process, its effects should be optimized using XRD analysis to obtain the most "bang for the buck". Characterization of residual stresses in peened components provides the information engineers and manufacturers need to properly manage the peening process to optimize product quality, minimize the effects of fatigue and stress corrosion for the end user, help minimize development and production costs, potentially reduce component weight and enhance component performance.
How does XRD work?
X-rays are diffracted by atoms arranged periodically in the grain structure of crystalline and polycrystalline materials such as metals and ceramics (see figure 1). The angle of a diffracted x-ray beam ? is related to the atomic lattice spacing d via Braggs law: n ??= 2 d sin ? where ? is the wavelength of the incident x-ray beam and n =1 for first order diffraction (see figure 2). By measuring the diffraction angle ? for a given wavelength ?, the atomic d-spacing and thus the strain can be calculated for the sampled volume. The stress is then calculated by applying elasticity theory.
What can XRD tell that the Almen strip cannot?
Peening effectiveness is normally characterized via the Almen intensity and the % coverage. It should be noted that many potentially different residual stress gradients can result from what may appear to be the same deflection of the Almen strip and observed % coverage. The % coverage is an optical assessment of the "as peened" surface, and is generally thought of as a measure of the uniformity of peening on the component surface. However, uniform coverage does not always result in a uniform stress state. Consider the following example of a weldment shot peened with CW-28 shot at 16-18A intensity with 125% coverage. To verify the effectiveness of the peening process, a section of the weld was masked off and was not peened so as to compare the "peened" and "as welded" conditions (see figure 3). The residual stress was mapped over an area encompassing both the peened and unpeened portions of the weld and parent material. It can be seen in figure 4 that the shot peening technique used had a significant effect on the stress state of the weld and parent material as seen by the "step" or drop in residual stress near the center of the map. On the left hand side of the map the "as welded" stress state has tensile residual stresses in the weld and the weld heat affected zone (HAZ) and neutral or slightly compressive stresses on average in the parent material. The right hand side of this map shows the peened area where the characteristic profile is much more compressive (less tensile) and uniform in the parent material but a reduced tensile residual stress state remains in the weld. This indicates that the peening process had the effect of reducing the tensile residual stresses in the weld and HAZ while introducing compressive residual stresses in the parent material. The peening was not sufficient to force the weld and HAZ entirely into compression in the sampled volume. This would suggest that the peening parameters could be changed to increase the compressive residual stress imparted upon the weld and HAZ or that a stress relief heat treat cycle could be applied prior to peening. This kind of information cannot be obtained using the standard Almen strip test and the assessment of the % coverage.
Can one use XRD in the lab?
Yes. XRD has been used extensively to measure the residual stress in peened components in a laboratory environment. Since varying peening parameters can result in different subsurface residual stress gradients, the residual stress in peened components must initially be evaluated as a function of depth. Figure 5 shows a lab based XRD instrument characterizing residual stresses in titanium alloy components. The stress vs. depth profiles for various peening parameters on the titanium alloy components can be seen in figure 6. In this case, the effect of varying the peening intensity on the same component resulted in quite different residual stress gradients as a function of depth. This information was used to select the best peening parameters for the intended application.
Can one use XRD in the field?
Yes. XRD has been used on large components on the shop floor and in the field. Residual stress measurements were performed on a large pinion gear at different locations where various shot peening parameters were applied (see figures 7 and 8). The resultant residual stress vs. depth plot (see figure 9) demonstrates how the effect of the peening process varies with depth as a function of peening intensity, shot size and shot hardness. For an accurate assessment of the peening process applied, the actual residual stresses present in the peened component(s) must be measured. This is because the apparent Almen intensity is a result of the total through thickness effect on the Almen strip. Hence, steeper more intense compressive stress gradients can potentially result in the same apparent Almen strip curvature as deeper reaching but less intense compressive stress gradients. Additionally, the width/breadth of the x-ray diffraction peak is related to the dislocation density in the sampled volume thus an empirical measure of the net work hardening present in the sampled volume due to peening as a function of depth can be obtained (see figure 10).
Can one use XRD inline and in audit stations?
Yes. Recent advances in detector technology and computing power have made XRD based residual stress measurement data acquisition and analysis possible in near real time. Once the residual stress profile as a function of depth has been established for a given component and process, surface measurements can be performed completely nondestructively for 100% inline inspection and quality assurance. Since XRD can be used to measure surface residual stresses nondestructively it can be used to: a) track changes in the residual stress on the exact same part at the exact same location through various production stages, b) quantitatively monitor the resultant residual stresses and c) subsequently provide verification of quality. Thus, XRD can be used to determine when and how potentially harmful stresses are introduced into a component. The effectiveness of potential corrective actions can then be evaluated, implemented and monitored.
How can one apply XRD to their parts?
XRD has been used to help identify stress fields created by overpeening that may actually decrease the service life of a component. It has also been used to help narrow the scope (i.e. the number of parts) for fatigue testing which can be quite expensive and time consuming. XRD can be used as a quality assurance tool in audit stations or for 100% inline inspection. XRD can also be used in the laboratory or in the field for process optimization.
For Information:
Proto Mfg. Ltd., 2175 Solar Cr.
Oldcastle, Ontario, Canada, N0R 1L0
Tel: +1.519.7376330, Fax: +1.519.7371692
e-mail: proto@protoxrd.com