E-Archive
Science Update
in Vol. 17 - May Issue - Year 2016
Surface Roughness Produced By Shot Peening On Aluminium Alloys

Figure 1: Geometric stress concentrations due to surface dents with different aspect ratios. Kt varies with the size and depth of the dimple, and is a function distance from the dimple centre.
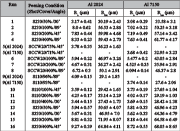
Table 1: Averaged values of Ra and Rt roughness parameters for both AA2024-T351 and 7150-T651 measured directly on the peened coupons for different peening conditions. Ra is only included as a comparison parameter.
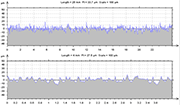
Figure 2: Roughness profile graphs from an AA-2024-T351 coupon with peening conditions: S110 (finest shot), 100% coverage and 45
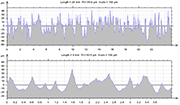
Figure 3: Roughness profile graphs of an AA-2024-T351 coupon with peening conditions: S330 (coarse shot), 100% coverage and 90
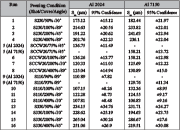
Table 2: Adjacent peak-to-peak averaged distances, denoted as Sm. The 95% confidence intervals are also shown.
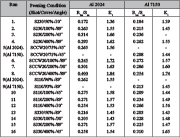
Table 3: Calculated stress concentration factors for each peening condition for both AA. The underlined numbers indicate that the ratio Rtm/Sm exceeded the restriction in Eq. (1). However, they are still useful as these did not overcome the limit of 0.4.

Figure 4: Schematic representation of variation of the incidence angle on the stress concentration factor (Kt). Because Kt is a function of the ratio h/d, an incidence angle of 45
Introduction
Shot peening (SP) is an inexpensive surface treatment that consists of projecting very hard, tiny, spherical ceramic or metallic balls at high speed over the surface of a metallic component. These impacts produce local surface plastic deformation in the form of dents, giving rise to a modification of the roughness and appearance of the surface, which, if properly controlled, can significantly improve the final properties of metallic components. It is clear that the surface stress will be intrinsically affected by surface topography. Nonetheless, there still is insufficient information regarding the quantification of the topography of shot-peened surfaces. A method for estimating a geometric stress concentration factor (Kt) due to multiple indentations was developed by Li, et al. [1] where extensive 3D stress analysis using finite elements was carried out and two general relationships for Kt were proposed, as follows:
"formula cannot be displayed online" (1)
* The annotated restrictions are in connection to the approximately linear relationship between the calculated Kt and the ratio H/D (equivalent to Rtm/Sm). It is still possible to obtain reasonable results up to Rtm/Sm ? 0.4. However, a loss of linearity above this ratio is expected and thus, results can be uncertain.
where Rtm represents the mean of all Rt's within an assessment length, and Rt is the maximum peak to valley height of the profile, in one sampling length. Sm is the mean spacing of adjacent local peaks of the profile, measured over the assessment length. The maximum Kt calculated is used, since it is assumed that a surface crack will tend to initiate at a location that possess the highest local stress concentration. The stress concentration due to surface roughness in a shot-peened specimen is a function of the average width and depth of an impacted dent (aspect ratio), as shown in Fig. 1.
In this work, an experimental and analytical methodology for quantifying the surface topography of an aluminium-peened surface under varied peening parameters is reported.
Experimental
Clausen and Stangenbert [2], have found that there is no clear dependence between the measured roughness values, the measuring direction, and the measuring point in a uniformly peened surface having coverage of ? 97%. Therefore, they proposed to follow the practice of taking at least ten measurements made at any point and in any direction that is desired, so that the average value can be used to represent the roughness of the surface. The surface roughness of a 2024-T351Aluminium Alloy specimen can then be expected to have a standard deviation of about 10%. Hence, this practice was adopted for conducting roughness measurements. An evaluation length of 4mm was chosen, each one containing five sample lengths of 0.8mm. Ten measurements were required in any direction to ensure sufficient accuracy. To reduce the number of measurements required, one measurement of 25mm length (equivalent to six 4mm evaluation lengths), and 4 additional measurements of 4mm length were undertaken. This gave the equivalent of ten profiles of 4mm in length, from which the values for S, Ra and Rt were found, and averaged to give Sm, Ram and Rtm.
The stress concentration factor, denoted as Kt, is the quantitative characterisation of the peening induced roughness. This factor is a function of the surface roughness parameters, Rtm and Sm. The calculated averages of the measured parameters Rt and Ra are listed in Table 1. Confidence intervals were quantified by using the Students' t-test distribution for critical points, i.e. confidence interval = ?±? where, ? = mean of sample, ? = standard deviation, n = sample size, t = read value from the Students' t-test distribution table of 90% confidence. The sample size was that of n = 10, with the number of degrees of freedom df = 9. A value of t = 1.833 was read from the corresponding Table 1.
A total of 30 readings of the S values (the adjacent peak-to-peak distances) were obtained for each peening condition from the respective roughness profile plots. The calculated average values are compiled in Table 2. Examples of the roughness graphical output profiles from where the S measurements were made are illustrated in Figs. 2-3. These profile plots also highlight the variation in surface topography between peened surfaces using the finest shot (S110) and coarse shot (S330), and the unpeened surface for the same AA.
Results And Final Remarks
Based on Eq. (1), the mean values Rtm and Sm compiled in Tables 1 and 2 were utilised for calculating the stress concentration factors, Kt's, which are listed in Table 3.
There is a clear proportionality between the size of the shot and the exhibited maximum peak to valley height (Rtm), i.e. the larger the shot, the deeper the impact, as observed in Table 1. Analogous observations can be drawn from Table 2, with regard to the exhibited peak-to-peak mean values (Sm) for both AA. However, there is no discernible correlation on the calculated stress concentrations. This latter observation leads to the assertion that stress concentration is shape- and not size-dependent, although notch sensitivity may be size-dependent. Higher roughness aspect ratios (Rtm / Sm) would result in higher stress concentrations.
In light of the above observations, the highest stress concentration values were found on the peened coupons with the shot type SCCW20, as can be seen in Table 3. To this end, the shot geometric features previously determined revealed that the highest scatter in roundness and aspect ratio distributions were exhibited by this type of shot. Furthermore, the surface that was peened with this kind of shot was found to consist largely of sharp peening indentations, namely, deep penetration with narrow dents, as shown in Tables 1 and 2. These findings support the observation made earlier concerning the dependence of indentation shape on the stress concentration factor.
Other features observed were: (i) surfaces peened with an impingement angle of 45°, have in general higher stress concentration than with 89°, and (ii) a marginal increasing of Kt was found to be associated with an increase of the percentage of coverage. A higher coverage would significantly result in a greater dent depth, whereas a moderate incidence angle of 45° may cause the dent width to be narrower than that of a dent caused by a normal (89°) incidence angle, as graphically illustrated in Fig. 4. These conditions may still increase the stress concentrations due to higher aspect ratio values.
Therefore, the geometric features of the shot, coverage and incidence angle were seen to play a major role in the stress concentration factor, Kt, which is believed to depend on the shape of the dimple left on the peened surface.
References
1. Li, J.K., Mei, Yao, Duo, Wang and Renzhi, Wang, (1992), "An analysis of stress concentrations caused by shot peening and its application in predicting fatigue strength." Fatigue and Fracture of Engineering Materials and Structures. Vol. 15, No. 12: pp. 1271-1279.
2. Clausen, R., (1999), "Roughness of shot-peened surfaces-Definition and measurement." In: Shot Peening: Present and Future. 7th International Conference on Shot Peening (ICSP-7). Warsaw, Poland. Ed. Aleksander Nakonieczny. Institute of precision mechanics
Public Education Secretary of Mexico
Instituto Tecnológico de Tlalnepantla del TecNM
Postgraduate Office/Department of Mechanical Engineering
E-mail: josesolis@infinitum.com.mx
rvelazquez@ittla.edu.mx
mparedes@ittla.edu.mx
ogomezv@ittla.edu.mx
vcastellanos@ittla.edu.mx


