E-Archive
Articles
in Vol. 17 - September Issue - Year 2016
Shot Peening Process. How Is Coverage Working? How Could Computer Software Help?
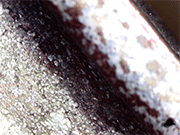
Picture 1: Microscope picture of the internal beam radius of a con' rod. Despite the surface being covered before peening with a red marker for a whiteboard, the geometry makes the coverage evaluation difficult.
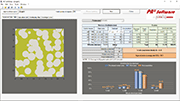
Picture 2: Screen shot of the artificial picture and data table

Picture 3: Screen shot of the overlapping map, with overlapping distribution
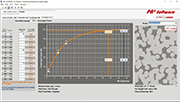
Picture 4: Screen shot of the coverage curve, including reference picture at the right and data input at the left

Fig. 1: Cold working process creating a crater
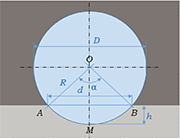
Fig. 2: Representation of crater size (d) and depth (h) vs. shot size (D)

Fig. 3: Simulation of random crater distribution

Fig. 4: Cross-section of a fully covered surface, clearly showing craters overlapping and the subsequent peaks and folds creation
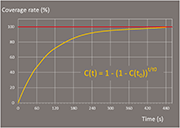
Chart 1: Coverage progression vs. peening time, according to Avrami Law
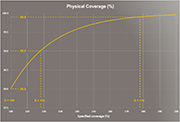
Chart 2: Physical coverage vs. specified coverage (S%)
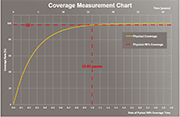
Chart 3: Physical coverage vs. rate of 98% coverage time
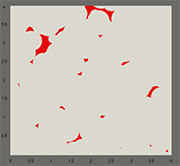
Picture 5: Computer-generated picture of a 98% covered surface. Background simulation of red marker for whiteboard.

Chart 4: Number of passes to reach 98% coverage vs. coverage after the first peening pass

Chart 5: Coverage rate vs. crater population density
New version of PA² Software, including coverage, from Peening Accessories. Introduction and theoretical aspects (1/2).
Introduction
Depending on target material ductility, peening parameters and component geometry, coverage evaluation can be very subjective (Pict. 1), especially when peening a very hard target material, after a first peening operation, using fine and light shot with low intensity.
In the 80's, computer popularization helped in industrial process assistance with mathematical models. Later on, mathematical models for Almen saturation and coverage were adopted in the SAE Standards, J2597 and J2277, where the algorithms and requirements were fully described. Since early 2000's, among several other ones, PA² Software allowed mastering the Almen saturation process. A new PA² Software version is now available online for full mastering of both Almen saturation and coverage processes.
Describing and quantifying, shot impact after shot impact, how the peening process is covering the surface of industrial components with craters.
This paper will focus on a few main questions about theoretical and practical aspects of the random process for changing the surface topography during a shot peening operation:
• How is each shot impact individually working and combining with all the other ones?
• Can we forecast how much of the surface area has been covered with craters after a given amount of peening?
• Which peening quantity, said "coverage rate", can be considered as optimal regarding overlapping?
The targets are:
• Creating artificial, but realistic reference coverage pictures (Pict. 2),
• Characterizing individual craters (Pict. 2) and craters overlapping population in number of overlapping spots and overlapping number at each spot (Pict. 3),
• Building the coverage curve and predicting the coverage rate for a given peening time (Pict. 4),
• Creating pedagogic material for Shot Peening Courses.
The purpose is here restricted to geometric and topographic aspects, not taking into account any other aspect of the shot peening process, such as residual stress distribution, microstructure changes, hardness evolution, etc. Therefore, in the calculations, only geometric parameters are taken into account.
Individual crater
Coverage starts with isolated craters formed during the shot impacts, randomly spread from the peening stream.
The contact begins when the shot hits the surface and starts penetrating the target until the material reaction is strong enough to stop it and send it bouncing away! The stress induced during the contact phase is large enough to overpass the target yield strength, which creates a permanent, plastic, deformation, which is like "memorizing" the shot shape as a "crater" into the target (Fig. 1).
The size (d) (1) and depth (h) (2) of each crater are dependent on individual shot characteristics and peening parameters (Fig. 2):
(1) "formula cannot be displayed online"
(2) "formula cannot be displayed online"
• Specific shot gravity,
• Shot size (D=2R),
• Shot and target mechanical properties,
• Peening intensity,
• Impingement angle, etc.
How then, is correlating the peening parameters and material characteristics with the crater geometry performed?
For poor crater population, most of the craters are isolated. For a given peening intensity, it is then easy to measure each actual crater size under the microscope and correlate with a given set of peening parameters (Fig. 3) [2].
Craters combination
The crater coordinates are randomly generated by "Monaco" principle. Impact after impact, the craters combination is creating a complex surface topography, with some overlapping happening, even for low coverage rates (Fig. 4) [2].
Coverage rate calculation
Coverage rate is expressed in percentage and defined as the ratio of the surface area covered with craters vs. the total reference surface area (3). i.e.: the square area of a picture taken from a microscope:
(3) "formula cannot be displayed online"
• Before starting the peening process, the surface is virginal from craters and the coverage is 0%.
• At the beginning of the peening process, there is a probability, close to 100%, for hitting a virginal area.
• When the surface is half covered, the worked surface area equals the virginal surface area and the coverage is 50%.
• At the end of the peening process, it becomes easier hitting a worked area, creating overlapping, than hitting a virginal area. Therefore, 100% coverage is theoretically impossible to reach: 100% is the horizontal asymptote to the coverage curve.
The coverage progression vs. peening time t is well modeled, using the Avrami law (4) [1] [3], where t is the peening time for which we would like to know the coverage rate and t0 is the time for which the coverage rate has been measured (Chart 1).
The coverage rate, Cn, for n passes, can also be expressed vs. the number of peening passes (4a). i.e., nozzle strokes, where C1 is the coverage rate measured after one peening pass.
(4a) Cn = 100[1-(1-C1)n]
Full coverage definition
Practically, after a given amount of craters, the reference area is almost fully covered with craters. Almost no area remains virginally intact from craters and the practical coverage rate is 100% or even higher.
If the peening operation is continued, the coverage rate cannot be quantified any further. The convention is to stop quantifying the coverage rate at 98% (Pict. 5) and consider only the peening time in order to quantify the coverage rate beyond 98%, as being the number of times the surface has been peened at 98% coverage. I.e.: 200% specified coverage cannot be measured, but it is defined as reaching for two times the peening time providing 98% measurable coverage rate. This means, for example that 118% specified coverage brings a physical coverage of 99% and 178% specified coverage brings 99.9% physical coverage (Chart 2). Furthermore, below 98% coverage, the coverage can be expressed as a rate of the physical 98% coverage time (Chart 3). This allows for easy understanding that 50% of the 98% coverage time corresponds with 86% coverage.
How many peening passes n are required to reach 98% coverage, when the coverage for one pass C1 has been measured?
The equation to solve is:
0.98 = 1 - (1 - C1)n
The solution (5), is displayed in Chart 4.
Time elimination, using the craters population density
Each crater projected area ai is given by the following formula (6), where di is the individual crater diameter. For a given number of craters n, the craters population density Dc (7) is then defined as the ratio between the sum of all individual crater surface areas and the reference surface area, with 1 ? i ? n:
(6) "formula cannot be displayed online"
(7) "formula cannot be displayed online"
• n is dependent on the shot mass flow rate, peening time and the mass of each individual shot.
• When the surface is free from any crater, DC = 0.
• When the sum of individual crater areas is equal to the reference surface area, then DC = 1.
• Since craters are randomly overlapping each other, when DC = 1, the reference surface cannot be fully covered with craters: C = 63.3%.
• The time can then be replaced with DC in the coverage calculation (8) (Chart 5).
What is the crater population density DC, when the coverage rate is 98%?
The equation to solve is:
98 = 100 (1 - e-Dc)
The solution is (9):
(9) Dc = -In(0.02) = 3.91
References
[1] Avrami M, J. Chem. Phys., 7, 1103, 1939; lbid., 8, 212, 1940; lbid., 9, 177, 1941.
[2] Knotec O and Elsing R, Computer simulation of different Surface Topographies of Metals Produced by Blasting Process, ICSP3, p361-368, 1987.
[3] SAE Standard J2277, Shot Peening Coverage Determination, revised 2013-04-24.
The Author:
François-Xavier Abadie
Business Development Manager, FROHN GmbH
Official Trainer and French MFN representative
PA² Software, designed and distributed
by Peening Accessories GmbH
Free downloading at: http//pa2.pointdoc.net/
No subscribing for limited test version.
Orders for unlimited version:
Peening Accessories
Frohbergstr. 38, 8620 Wetzikon, Switzerland
Tel. +41.44.831 26 44
Fax +41.44.831 26 45
E-mail : info@peening.ch
www.peening.ch


