E-Archive
MFN Trainer Column
in Vol. 17 - November Issue - Year 2016
Shot Peening Fine Tuning using Design of Experiments (DOE)
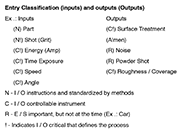
Figure 1: Process map example for shot peening
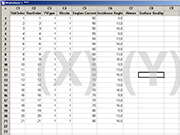
Table 1: Design of Experiments evaluating influence of variation of the motor current and incidence of shot angle in Almen measure and in the surface quality of the treated piece. Minitab software.
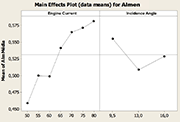
Figure 2: Turbine current and shot incidence angle influence on Almen variation
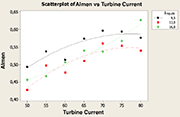
Figure 3: Correlation between turbine current, shot incidence angle and Almen measure
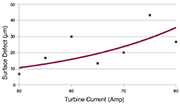
Figure 4: Correlation between current and surface defects

Freddy Poetscher
Despite being inevitable, large gains in quality and cost savings can be made by eliminating variation as much as possible in the shot peening process. But how to respond to variation, as it appears, for example, in the Almen measure and improve the process?
Using an experimental design approach at a shot peening process it is possible to:
• Measure and analyze the sources of variation;
• Make appropriate improvements to the systems and processes;
• Control and maintain the process improvements.
Accordingly, it is necessary to identify the sources of variation in the shot peening process. A process of shot peening with statistical control produces a data stream that can predict the variation and any characteristic, such as particle size, Almen, cover and so on. With periodic histograms assessing the main variables of the peening process it is possible to approximate the variation of a standard function Y = f (X), where Y could be Almen f mean (X) would consist of several variables, which for purposes of this article exemplified as f (Xgrit, XParticle size, XAmperage, XAngle).
The focus of the experiment is to understand the relationship between input and response, ie YAlmen = f (Xgrit, XParticle size, XAmperage, XAngle).
To identify these variables, we may use a tool known as process map and it is a visual representation of the above equation. It will systematically identify all shot-peening variables related to the desired attributes of the process and in our example, the measure Almen.
Briefly, a mapping could indicate the following relationships between the variables of the shot-peening process.
These variables in Figure 1 may be tested by creating directed experiments to quantify the influence of each of the parameters of interest. Thus, one could develop an experiment to identify the influence of variables (X): Power (Amp), Angle, Exposure Time in process results (Y): Almen, Surface defects, for example.
Table 1 represents a real experiment matrix used to quantitate the influence of variation in a shot peening process.
After completion of the above experiments, observing not to vary any other parameter that was established to study, it will be possible to determine the influence of variables (x) on the desired quality output (y) Almen and Quality Surface.
Statistics involved in this analysis are simple, but laborious. Aguas software packages can make this work easier, but you must have domain over the statistical method used to assure the correct result evaluation and analysis.
The following figures illustrate the results obtained in this analysis.
The analysis of these variations and influences determine the best working conditions for this shot-peening process and equipment. It is possible to verify the best angle of incidence of the shot and the ideal turbine power levels that provide a desired Almen without damaging the sample surface. The Design of Experiments applied in Shot Peening is a methodology that creates knowledge for process control and optimization.
For questions contact: freddy@mfn.li
Author: Freddy Poetscher


